Supervised vs Unsupervised Learning: A Comparison
Table of contents
Share blog post


Supervised learning trains models on labeled data to predict outcomes, while unsupervised learning works with unlabeled data to uncover patterns. This guide compares their methods, differences, and common applications.
Share blog post
What are supervised and unsupervised learning, and how do they differ? Below, we answer common questions about these two core machine learning approaches:
- What is supervised learning?
Supervised learning is a machine learning approach that trains models using labeled data (inputs paired with correct outputs). By learning from example input-output pairs, the model can later classify new data or predict outcomes accurately. In short, the algorithm “learns” from answers provided during training to make predictions on unseen data.
- What is unsupervised learning?
Unsupervised learning uses unlabeled data and lets the model find patterns or groupings on its own. The algorithm isn’t given any correct answers; instead, it discovers hidden patterns or structures in the input data without human guidance. For example, it might group customers by purchasing behavior or find anomalies without being told what to look for.
- What is the main difference between supervised and unsupervised learning?
The key difference is the use of labeled datasets. Supervised learning uses labeled inputs and outputs, so it knows the “right answer” during training and learns a mapping from inputs to outputs. Unsupervised learning uses unlabeled data, so it must infer patterns without guidance. Supervised models aim to predict specific outcomes (e.g., classify an email as spam/not spam), whereas unsupervised models aim to uncover insights or groupings in the data (e.g. segment customers by behavior).
- What are some examples of each approach?
In supervised learning, common applications include spam filtering, sentiment analysis, image classification, and predictive regression (e.g, forecasting house prices or sales). Popular supervised algorithms are linear regression, decision trees, random forests, neural networks, etc. In unsupervised learning, examples include clustering (e.g, grouping similar customers with k-means), anomaly detection (finding outliers in network data), recommendation systems (finding “items that go together”), and dimensionality reduction techniques like PCA for data exploration.
- When should you use supervised vs unsupervised learning?
Use supervised learning when you have a well-defined target outcome and labeled data (for example, you want to train a model to predict or classify with known correct answers). Use unsupervised learning when you have lots of unlabeled data and want to explore or understand its structure – for instance, to discover segments or anomalies. In practice, if you know the output you need and can obtain labels, supervised methods give more accurate directed results. If you don’t have labels and are looking for unknown patterns, unsupervised methods are the way to go. Often, a combination (or semi-supervised approach) can be used to leverage the strengths of both.
Machine learning (ML) models are already used in many modern real-world applications. They are deployed in a variety of settings, but the steps needed to train them vary depending on the task and the available data.
Two key training approaches are supervised learning and unsupervised learning.
In this guide, we will walk you through everything you need to know about supervised vs. unsupervised learning.
Here’s what we’ll cover:
- What is Supervised Learning?
- What is Unsupervised Learning?
- Supervised vs Unsupervised: Key Differences
- Examples of Supervised and Unsupervised Learning in Action
- Choosing the Right Approach
- Semi-Supervised Learning and Active Learning
- How Lightly AI Bridges the Gap Between Both
Choosing the right training approaches is important to build accurate computer vision models, but the quality and selection of your training data matter just as much.
We at Lightly help you to make the most of your datasets with:
- LightlyOne: Curate the most representative samples from large datasets to make supervised learning models more accurate or to find hidden trends in unsupervised learning tasks.
- LightlyTrain: Pretrain and fine-tune supervised learning models on curated datasets to accelerate training for tasks like image classification, object detection, and semantic segmentation.
Together, they help train powerful, domain-specific vision models with less effort and better generalization.
See Lightly in Action
Curate and label data, fine-tune foundation models — all in one platform.
Book a Demo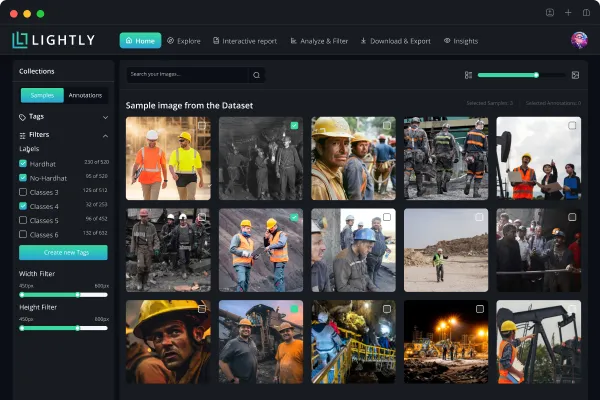
What is Supervised Learning? (Labeled Data and Predictive Modeling)
Supervised learning is a type of machine learning where an algorithm learns from a set of training data that has already been labeled with the correct answers.
The data is often labeled by a data scientist in the preparation phase, before using it to train (supervise) the model. Each piece of training data consists of inputs (or features) and outputs (categories or labels).
A supervised machine learning model learns to map inputs to outputs during training, so it can answer (predict outcomes) unseen data correctly by itself.
The difference in predictions and the actual answers (labeled output data), called the error, helps the model measure its accuracy and improve over time.
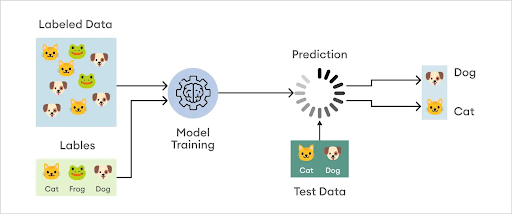
Here's how it looks in practice.
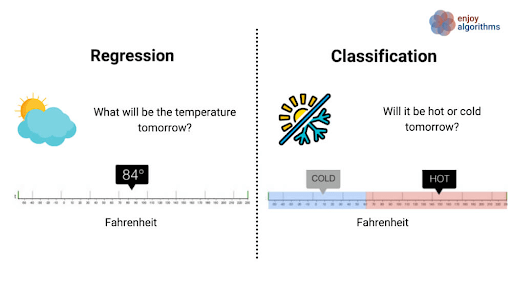
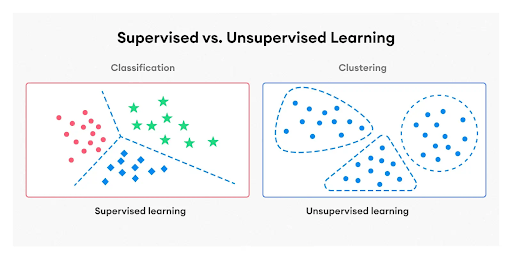
Supervised learning can be separated into two types of problems: classification and regression.
Classification
Classification problems use an algorithm to predict and assign test input data into a discrete category or class label.
For example, an email is either spam or not spam. An image might contain a cat, a dog, or a bird. When there are more than two categories, it is referred to as multiple-class classification.
Some of the most common classification algorithms include:
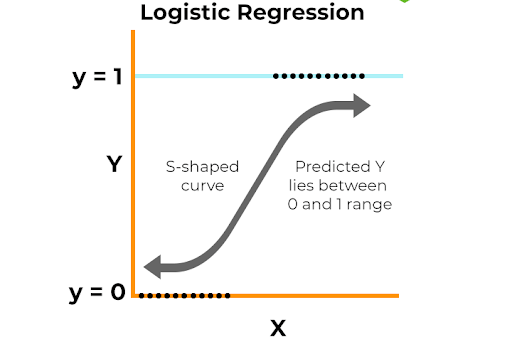
- Logistic Regression: It is used for classification (despite its name) and predicts the probability of an input belonging to a specific class. It's used for binary classification problems, such as determining if a credit card transaction is fraudulent (1) or not (0).
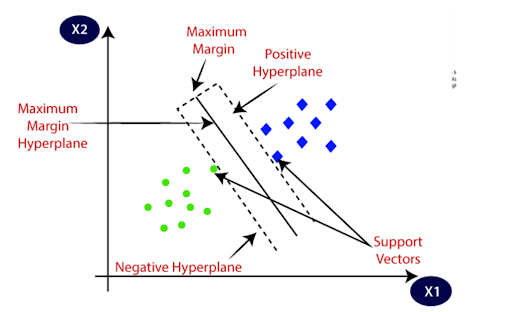
- Support Vector Machines: SVM is another powerful classification algorithm that finds the best boundary (hyperplane) that separates different classes in data points. It maximizes the margin between the classes to correctly classify unforeseen data.
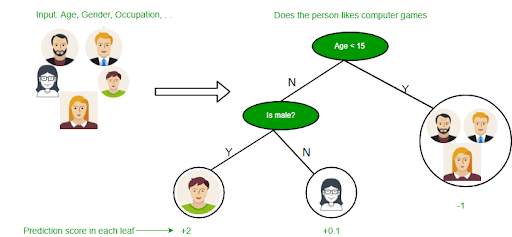
- Decision Trees: A decision tree model makes predictions by learning decision rules (if-then-else) from the data features. It splits the data into smaller and smaller subsets, creating a tree-like structure. Each leaf node represents a class label.
- Random Forests: It builds multiple decision trees during training and takes the prediction from each tree and picks the one that gets the most votes. This approach yields a more accurate and stable ML model than a single decision tree.

Regression
Regression uses an algorithm to predict a continuous numerical value for a given input. Here, the output is a real number or quantity, not a category.
For example, predicting the price of a house, forecasting sales for the next quarter, or estimating a temperature.
Some common regression task algorithms and models include:
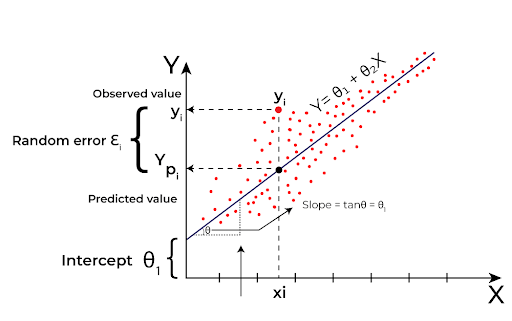
- Linear Regression: It finds a straight-line relationship between the dependent and independent variables. It assumes that as the input variable (independent variable) increases or decreases, the output variable does so in a linear fashion.
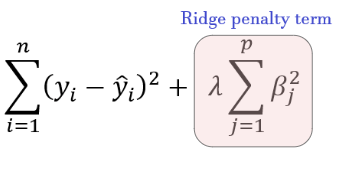
- Ridge Regression: A variation of linear regression used to prevent overfitting, where the model learns the training data too well, including its noise, and fails to generalize to new data. It does this by adding a penalty term, proportional to the square of the magnitude of the coefficients (an L2 penalty), to the loss function.
- Lasso Regression: Similar to Ridge, Lasso also helps prevent overfitting. It adds an L1 penalty and performs feature selection by reducing the coefficients of less important features to zero and removing them from the model.

What is Unsupervised Learning? (Unlabeled Data and Pattern Discovery)
Unsupervised learning is an ML approach that involves the training of algorithms on raw and unlabeled data.
Unlike supervised learning (where we know what outcomes to expect), an unsupervised learning algorithm discovers patterns, trends, and groups of similar data without prior training or labels.
Also, the success of an unsupervised learning model is often harder to tell because there are no correct answers to compare it to.
Instead, metrics like Silhouette Score or Davies-Bouldin Index for clustering, or human evaluation, can be used to determine if the discovered patterns are useful and make sense.
Since most real-world data is unlabeled, data scientists often use this unsupervised approach in the early exploratory data analysis phase to gain a better understanding of their datasets.

Unsupervised learning models are used for three main tasks: clustering, association rule learning, and dimensionality reduction.
Clustering
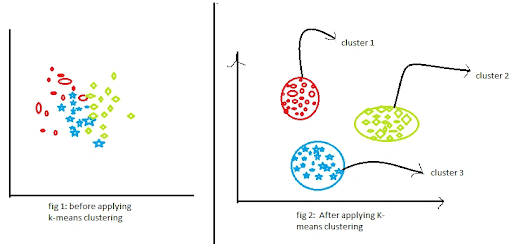
Clustering groups different data points together. Clustering algorithms work by gradually moving each data point closer to the center of its group and away from other groups.
Popular clustering algorithms include:
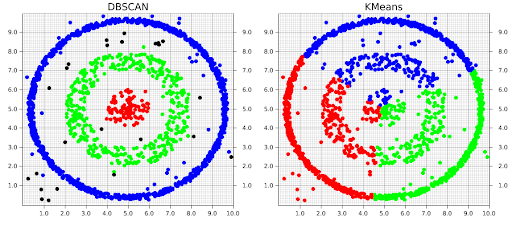
- K-means Clustering: It sorts data into k clusters by assigning each point to the nearest cluster center (centroid) and then iteratively updating the centroids.
- Hierarchical Clustering: Groups items into a tree-like structure (dendrogram) without needing to specify the number of clusters beforehand.

- DBSCAN (Density-Based Spatial Clustering of Applications with Noise): DBSCAN groups similar data points that are close to each other. It also identifies points that are isolated in low-density areas as outliers.
Association Rule Learning (ARL)
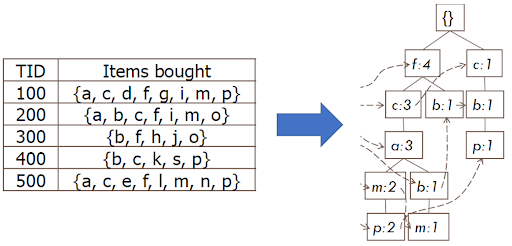
ARL finds interesting and frequent relationships between items in large datasets (represented as an if-then rule). It's famously used for market basket analysis to discover which products are often bought together.
Some key algorithms include:
- Apriori Algorithm: It identifies frequent item sets by using a bottom-up approach. It works on the principle that if an itemset appears often, then all of its subsets must also appear often. It helps to prune the search space efficiently.

- FP-Growth Algorithm: The FP-growth algorithm organizes data into a compact tree structure called a Frequent-Pattern Tree (FP-tree). It finds itemsets directly from this tree, which makes it faster because it does not need to repeatedly test different combinations like other methods do.
Dimensionality Reduction
Dimensionality reduction algorithms reduce the number of features or variables in a dataset while retaining as much valuable information as possible.
Here are some prominent dimensionality reduction algorithms:
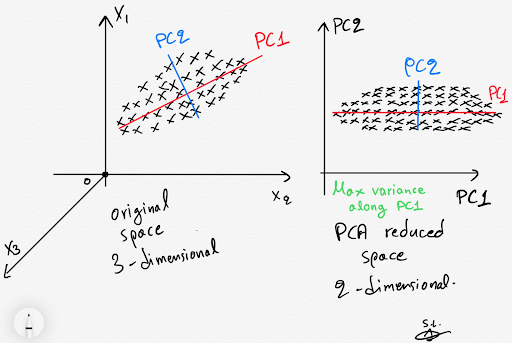
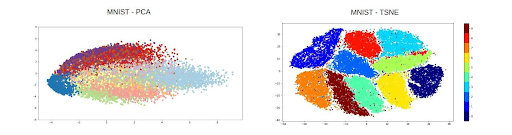
- Principal Component Analysis (PCA): PCA transforms the data into a new coordinate system by identifying orthogonal (uncorrelated) principal components that capture maximum variance in the data. It then projects the data onto a lower-dimensional subspace.
- t-Distributed Stochastic Neighbor Embedding (t-SNE): It reduces and visualizes high-dimensional data in a low-dimensional space (a 2D or 3D map). It also ensures that similar data points in the original data remain close in the new map.
Supervised vs Unsupervised Learning: Key Differences
The key difference in the supervised vs unsupervised learning debate is whether the data is labeled, but their goals, methods, and uses also differ.
Here's a detailed comparison:
Examples of Supervised Learning in Action (Use Cases and Algorithms)
Supervised learning models are all around us and integrated in many applications that make predictions and automate decisions.
Let's walk through a few detailed examples.
Image Classification
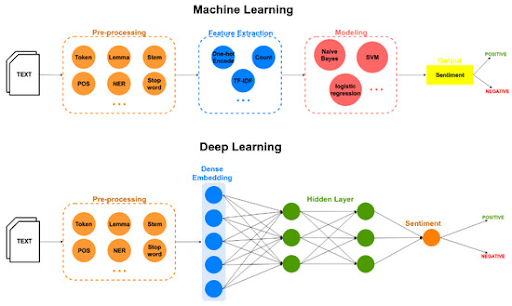
A supervised machine learning model, like deep neural networks such as CNNs, learns from a large set of labeled images.
It identifies objects by recognizing visual features such as edges, textures, and shapes. It can then tell if a photo contains the object we are trying to predict.
Image classification powers many applications, like a photo gallery app on your phone that organizes images. It helps in medical diagnoses by classifying different diseases, and in many other areas.

💡 Pro Tip: When exploring the spectrum between classical supervised methods and modern representation learning, our OpenAI CLIP Model Explained article clarifies how CLIP’s contrastive language-image pre-training bridges these paradigms in practice.
Spam Detection for Emails
Filtering junk email is a binary classification problem where we teach a model on a large corpus of emails that have been manually labeled as spam or not spam.
The model then learns what features are common in spam emails, such as certain words, sender information, or email structure.
Once trained, it can check new emails and automatically decide if they are spam or not in real-time.
An example of this is the spam filter used in Google Gmail, which automatically moves junk emails to a separate folder so your inbox stays clean.

Sentiment Analysis
Sentiment analysis determines the emotional tone behind a piece of text. We can use it to understand public opinion from things like product reviews, social media comments, or customer surveys.
To do this, we train a model using examples of text that are labeled as positive, negative, or neutral.
After training, it predicts new text and provides insights into customer satisfaction and brand perception at scale.
Examples of Unsupervised Learning in Action (Use Cases and Techniques)
Unsupervised learning is good at finding structure in data without any predefined labels to guide it that humans might miss. These are some practical examples of unsupervised learning.
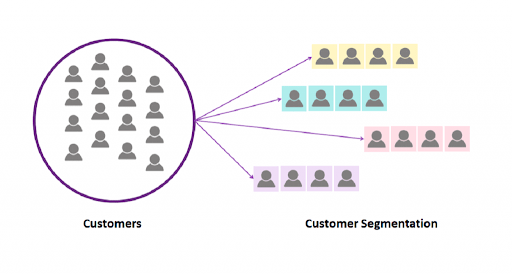
Customer Segmentation (Clustering in Marketing)
Businesses use clustering algorithms like k-means to segment customers into groups based on purchasing behavior or demographics from large, unlabeled databases. This enables targeted marketing for each group's preferences.
Anomaly Detection in Fraud and Security
Anomaly detection (an unsupervised learning method) is used in finance and cybersecurity to find unusual activities.
In finance, it helps spot credit card transactions that deviate greatly from the norm, which could be signs of fraud.
In cybersecurity, it detects unusual network behaviors that might mean someone is trying to break into a system.
The model learns what normal behavior looks like from unlabeled data and flags events that fall outside that pattern.
Pros, Cons, and Challenges of Each Approach
No single approach is best for every problem. Each type has its strengths and weaknesses. Let's begin with the advantages and challenges of supervised learning.
Advantages and Challenges of Supervised Learning
Supervised learning stands out when you need precise predictions. Here are its key benefits:
- Since supervised learning models are trained with a specific goal and correct answers, they often reach high accuracy.
- Supervised models work well for many tasks, from sentiment analysis in text to predicting continuous outcomes like house prices.
- It can handle both classification (sorting data into categories) and regression (predicting numbers), which makes it flexible for different problems.
Disadvantages:
- It relies on a labeled dataset, and creating such datasets takes time and capital. It is also prone to errors from human labeling.
- Supervised models can sometimes memorize (overfit) the training data but perform poorly on new, unseen data.
- These models need regular updates with fresh labeled output data to stay effective as real-world data changes.
Now that we've covered supervised learning, let's shift to unsupervised learning.
Advantages and Challenges of Unsupervised Learning
Unsupervised learning works best when you want to explore data without predefined answers. Here are its key strengths:
- It doesn’t need labeled data, so we can start analyzing large datasets quickly.
- Unsupervised learning algorithms handle large volumes of data. They reduce complexity through dimensionality reduction techniques and keep important information intact.
- Unsupervised models show trends and clusters that help understand unlabeled data deeply.
Disadvantages:
- It's hard to measure accuracy without labeled data. Evaluation often relies on subjective checks or proxy metrics.
- After running clustering algorithms, we may need to manually check and label these groups, which takes time.
- Noise, outliers, or missing data can distort results and affect the quality of unsupervised learning methods.
Choosing the Right Approach: When to Use Supervised vs Unsupervised
Choosing the right method depends on your overall goals and requirements, the use cases you wish to solve, the tools and time you have, and how you handle data.
Consider the following things when deciding the best option for your ML projects.
- Is your data labeled or unlabeled? Supervised learning needs labeled datasets. So check if your team has the time, resources, and skills to label and validate data. Otherwise, unsupervised learning is the way to go.
- Think about your goals, too. It’s essential to consider the type of problem you are trying to solve and whether you're creating a prediction model or seeking to discover new insights or hidden patterns in the data.
- Furthermore, consider the type of algorithms you require. Make sure they can handle your data size and match the required dimensions, such as the number of features and attributes.
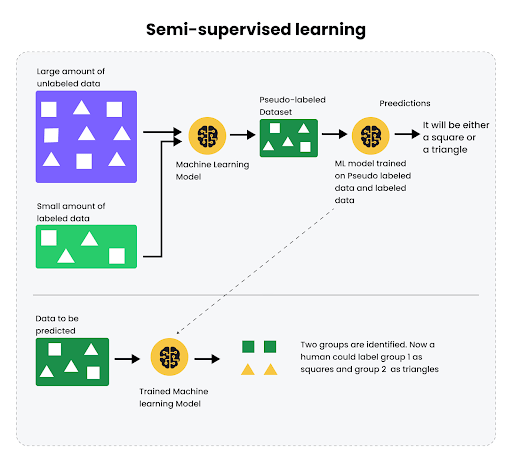
Semi-Supervised Learning and Active Learning (Bridging Both Worlds)
In many real-world situations, we have a small labeled dataset and lots of unlabeled data. Instead of choosing fully supervised and unsupervised learning, consider a hybrid approach like semi-supervised and active learning.
Semi-supervised learning combines both techniques by using labeled and unlabeled data in the training process.
It uses a small set of labeled data to guide learning while tapping into abundant unlabeled data to find hidden patterns.
On the other hand, active learning addresses the high cost of data labeling.
In active learning, the model interactively asks a human oracle (an annotator) to label new data points that it considers most informative from large amounts of unlabeled data.
You can use a platform like LightlyOne to scale active learning and reduce labeling costs by focusing on data that improves the model the most.

Besides these, another technique we can use is self-supervised learning, where a model creates its own labels from the input data.
For example, it might take an image, hide a small patch, and then try to predict the contents of the missing patch. In this case, the hidden patch becomes the "label" the model learns from.

How Lightly AI Bridges the Gap Between Supervised and Unsupervised Learning
The choice between supervised and unsupervised learning comes down to a trade-off: use costly labeled data for accuracy or plentiful unlabeled data for general insights.
Lightly AI offers a solution that combines the best of both approaches to build better models.
Instead of manually labeling a large image dataset for supervised learning, you can start with all your raw, unlabeled data.
- LightlyTrain uses self-supervised learning to pre-train your model on your entire pool of unlabeled images or videos. This is an unsupervised step that teaches your model the specific visual patterns of your domain, giving it a smarter starting point before fine-tuning.
- LightlyOne uses active learning principles to curate the most representative samples from your large, unlabeled dataset. It helps you build a small, high-impact labeled dataset for fine-tuning. LightlyOne picks the most useful data points for a human to label, filtering out redundant samples and reducing labeling costs.
And if you're working with NLP or multimodal tasks. Then you can explore Lightly's AI Data Services, which provide high-quality, labeled datasets tailored to your use case for pretraining, fine-tuning, and model evaluation.
Conclusion
Supervised and unsupervised learning are the backbone of many ML systems we encounter daily. Supervised learning makes precise predictions with labeled data, while unsupervised learning uncovers hidden patterns in unlabeled data.
Understanding the distinction between supervised vs. unsupervised learning is key to designing effective ML systems. By choosing the right approach or a smart combination of both, you can create models faster and affordably.

Stay ahead in computer vision
Get exclusive insights, tips, and updates from the Lightly.ai team.

.png)
.png)