Mastering the F1 Score: A Practical Guide for Machine Learning Success
Table of contents
Share blog post


The F1 Score is a key metric for evaluating classification models, especially with imbalanced data. It balances precision and recall to reflect a model’s true performance, offering a more reliable alternative to accuracy in tasks like fraud detection.
Share blog post
Below, you can find a quick summary of key points about the F1 score.
What is the F1 Score?
The F1 score is the harmonic mean of precision (P) and recall (R), ranging from 0 (worst) to 1 (best).
.png)
A score of 1 indicates that both precision and recall are 100%. A score of 0 indicates that the model has failed completely, either in precision or recall.
How to interpret the F1 Score?
A higher F1 score (closer to 1) indicates that the model is effective at finding the positive class and makes few mistakes. If either precision or recall is low, the F1 score will also be low. F1 is only high when both are high.
For example, a model with 90% precision and recall achieves an F1 of approximately 0.90. In comparison, a model with 90% precision but only 10% recall drops to an F1 of about 0.18. This shows a balanced performance metric, as measured by F1, rather than focusing only on excellence in a single metric.
Why use F1 over accuracy?
Accuracy can be misleading when classes are imbalanced. F1 is better for such cases because it focuses on the positive class and accounts for both false positives and false negatives. For example, in fraud detection, a model that always predicts "not fraud" will have high accuracy. Whereas an F1 score of 0 which reflects its poor performance metric.
Introduction
Evaluating classification models is a key part of any machine learning (ML) workflow. While the accuracy metric is common, it is often unreliable for imbalanced datasets. The F1 score combines both precision and recall to provide a clearer view when false positives and false negatives matter.
This article covers the F1 score, its importance, and how to apply it in real-world ML and computer vision tasks like fraud detection, medical diagnosis, and quality control.
We will explore the following:
- What is the F1 Score?
- Understanding Precision, Recall, and Accuracy
- F1 Score vs. Other Evaluation Metrics
- Precision-Recall Trade-offs and F-beta Score
- Real-World Applications
- Limitations and Considerations
And remember, improving your F1 score starts long before evaluation - it starts with better data. At Lightly, we help you boost model performance by focusing on the data that matters most:
- LightlyTrain: Pretrain and fine-tune models that are more robust to imbalanced and noisy data.
- LightlyOne: Curate high-impact samples to reduce false positives and false negatives during training.
Better data selection leads to more reliable metrics and better models.
See Lightly in Action
Curate and label data, fine-tune foundation models — all in one platform.
Book a Demo
What is the F1 Score?
The F1 score, also known as ‘F-score’ or ‘F-measure’, is the harmonic mean of precision and recall. It provides a single number that balances both precision and recall, which helps you compare machine learning models more effectively. Mathematically, it is defined as:
Where precision (P) is the fraction of predicted positives that are correct, and recall (R) is the fraction of true instances that are correctly identified.
Alternatively, in terms of true positives (TP), false positives (FP), and false negatives (FN):
The F1 Score ranges from 0 to 1. It only reaches a high value when both precision and recall are high (near 1). This makes it a strict but fair way to measure balanced performance, especially in situations involving imbalanced classes. If either metric is low, the F1 score drops quickly.
It is useful when you want to balance catching all positive cases and avoiding false alarms. Additionally, it is a part of the F-beta (Fβ) family, where F1 gives equal weight to both precision and recall. Fβ allows you to prioritize one over the other depending on your use case.
Understanding Precision, Recall, and Accuracy
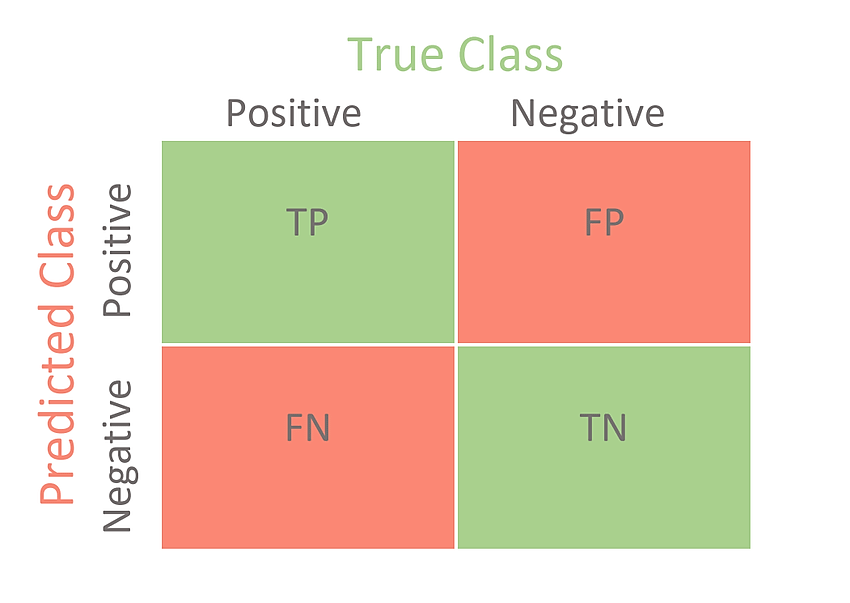
To understand the F1 score, it is helpful first to understand the concepts of precision, recall, and accuracy. All three come from the confusion matrix, which is a standard tool for evaluating binary classification models.
Confusion matrix and basic terms
A confusion matrix is a 2×2 table that summarizes prediction results for binary classification. It organizes predictions into four categories:
The following confusion matrix provides the counts of TP, FP, FN, and TN, which are the basis for calculating all these metrics. It helps identify the types of errors a model makes and supports reliable metric selection and model improvement.
Precision
Precision is the positive predictive value. It measures the quality of positive predictions by calculating the proportion of correctly identified positives among all positive predictions:
High precision means fewer false positives. In other words, when the model says “positive,” it is usually correct. Precision ignores the false negatives and true negatives. This is important in cases like spam detection, where you don’t want to flag real emails as spam. Here, a real email classified as spam would be a false positive.
Recall
Recall is also called sensitivity or the true positive rate. It measures how well the model finds all actual positive instances by calculating the proportion of actual positive instances it correctly identifies:
High recall means the model missed fewer positive cases, i.e., a few false negatives (FN). Recall ignores false positives. A model that labels every sample as positive will have a recall = 1 (detects all positives).
However, that model’s precision may be low if it also marks negatives as positives. This metric, where FN represents missed cases, is important in domains like medical testing, where missing a disease can be costly. Here, a patient may be classified as not having a disease (false negative) when, in reality, they may be suffering from a serious condition.
Accuracy
Accuracy is the overall fraction of correct predictions:
It considers both classes, but it can be misleading if classes are imbalanced. For example, if 95 out of 100 emails are not spam. Then, a model that always predicts "not spam" will be 95% accurate but will never catch any actual spam.
Pro Tip: Check out also our Image Classification Guide for Engineers.
Why not just use accuracy?
In datasets where one class dominates the data, the model’s accuracy can be misleading. While the accuracy metric measures general correctness, it fails to reflect class imbalance or types of errors.
For example, in a medical test where only 1 in 1,000 patients has a disease, a model that always predicts "healthy" achieves 99.9% accuracy. But it provides a low true positive rate (0% recall), and an F1 score of nearly 0 (since TP = 0, recall = 0). This means that it never finds the disease.
In this case, the F1 score offers a more balanced evaluation that addresses this limitation for imbalanced datasets by summarizing model performance in one metric. It penalizes both false positives and false negatives, offering a clearer view of how well the model identifies the positive class.
F1 Score vs. Other Evaluation Metrics
Different metrics serve various purposes in model performance metrics. Below is a comparison to help you understand when to use each reliable metric for specific business needs and requirements:
| Metric | Formula | Strengths | Limitations |
|---|---|---|---|
| Accuracy |  |
Simple, intuitive | Misleading on imbalanced data; hides types of errors |
| Precision |  |
Few false positives, good for reliability (e.g., spam or fraud detection) | Ignores false negatives |
| Recall |  |
Few false negatives, good for completeness (e.g., medical tests) | Ignores false positives |
| F1 Score |  |
Balances model’s precision and recall; useful for skewed data | Ignores true negatives and is hard to interpret for multi-class classification problems |
| ROC-AUC | Receiver Operating Characteristic - Area under the ROC Curve | Evaluates across thresholds | Misleading with imbalanced data |
Detailed metric comparison
Let’s expand on this comparison to help you choose the reliable metric for your problem:
- F1 Score vs. Accuracy: The accuracy metric measures overall correctness across the entire dataset, including true negatives, but can be misleading if the dataset is imbalanced. F1 focuses on positive class performance and is more meaningful when class distribution is skewed or when the model’s precision or recall is low.
- F1 Score vs. Precision vs. Recall: Precision measures how many predicted positives are correct. Whereas recall measures how many actual positive instances are found. F1 balances both and provides a single reliable metric for overall positive class performance. Models with the same F1 can have different precision-recall trade-offs.
- F1 Score vs. ROC-AUC: AUC-ROC evaluates model performance metric across all classification thresholds and includes true negatives. It is threshold-independent but can be overly optimistic when applied to imbalanced data. F1 is preferred when a single threshold-specific summary is needed, especially with imbalanced datasets.
Precision-Recall Trade-offs and F-beta Score
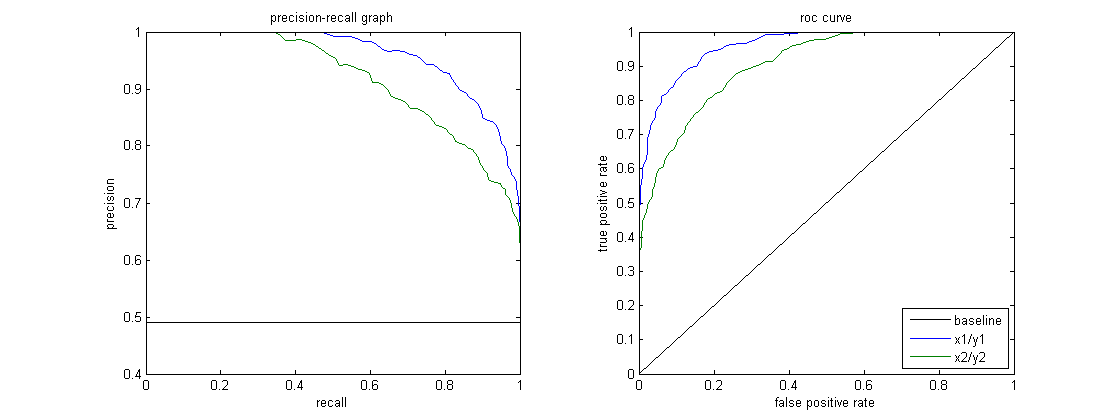
Changing the classification threshold affects the trade-off between both precision and recall. Raising the threshold increases the model’s precision (fewer false positives) but lowers recall (more false negatives). Lowering it has the reverse effect.
The Precision-Recall (PR) curve shows this trade-off across different thresholds, and the F1 score helps find the best balance for your use case.
- High Precision, Low Recall: The model is cautious and flags fewer positives. This reduces false positives but may miss many actual cases. For example, a strict spam filter only flags obvious spam and rarely mislabels real emails. However, it may miss spam emails that are not so obvious.
- High Recall, Low Precision: The model is aggressive and catches most positives, but also includes many false alarms. A sensitive spam filter might catch nearly all spam but also flag some legitimate messages.
F-beta score
When precision and recall require different emphasis, the F-beta (Fβ) score provides weighted alternatives to the standard F1 score. It is defined as:
.png)
where;
- β > 1: Emphasizes recall over precision (e.g., F2 score for medical diagnosis)
- β = 1: Balances precision and recall equally (standard F1)
- β < 1: Emphasizes precision over recall (e.g., F0.5 for spam detection)
For example, in fraud detection, it is often more important to catch all fraudulent transactions, even if that means raising some false alarms. In such cases, the F2 score is used to put more weight on recall over precision.
Real-World Applications of F1 Score
The F1 Score is commonly used in ML tasks with imbalanced datasets or when both error types matter. For multi-class settings, it is calculated through micro or macro averages to balance performance across classes.
The F1 score has widespread use in the following cases:
Fraud detection
Financial institutions use the F1 score to evaluate fraud detection models, where fraudulent cases make up less than 1% of transactions. These systems must accurately detect fraud while avoiding false alarms that block legitimate activity. It is crucial to minimize situations where the model predicts negative cases as fraudulent, such as false positives.
A high F1 score shows the model captures fraud effectively while balancing both detection accuracy and customer experience.
Business impact: High precision reduces false alarms that block legitimate transactions and frustrate customers. High recall ensures fraudulent transactions are caught before they cause financial losses. F1 score captures both requirements in a single metric aligned with business objectives.
Medical diagnosis
F1 is used to evaluate diagnostic models in healthcare applications. Rare diseases or conditions (like early cancer detection) require high recall (few missed cases) and avoiding unnecessary procedures (reasonable precision).
F1 evaluates diagnostic models where both false positives and false negatives, compared against true labels, carry significant consequences.
Clinical considerations: Missing a disease (false negative) could delay critical treatment, while over-diagnosing (false positives) leads to unnecessary anxiety and medical procedures. F1 score ensures models balance both concerns appropriately.
Spam detection and content moderation
Email providers and social media platforms use the F1 score to evaluate content filtering systems. The goal is to detect harmful or spam content accurately without wrongly blocking legitimate messages. For instance, non-spam emails (i.e., the negative class) should not be flagged as harmful, ensuring the user experience is minimally disrupted.
Implementation challenges: Spam detection models often prioritize precision to minimize false positives, and thus may use the F0.5 score, which weighs precision higher. In contrast, content moderation platforms may use the balanced F1 or F2 score (which favors recall more), depending on how urgently they need to remove harmful content versus allowing free expression.
Information retrieval and NLP
F1 is widely used in natural language processing (NLP) tasks, such as named-entity recognition (NER), document retrieval, and question answering (Q&A). It helps balance the relevance of retrieved documents (precision) with the recall of all relevant items.
Technical applications: Modern large language models (LLMs) use the F1 score for evaluating generated content accuracy. They measure how well models retrieve relevant information and avoid hallucinations or irrelevant responses.
Example: Python code
F1 can easily be computed using libraries. Here is how to calculate a basic F1 score for a binary classification problem in Python:
from sklearn.metrics import f1_score, confusion_matrix, classification_report
import numpy as np
# Example: Credit card fraud detection results
y_true = [0, 0, 0, 0, 0, 1, 1, 1, 0, 0] # True labels
y_pred = [0, 1, 0, 0, 0, 1, 0, 1, 0, 0] # Model predictions
# Calculate F1 score
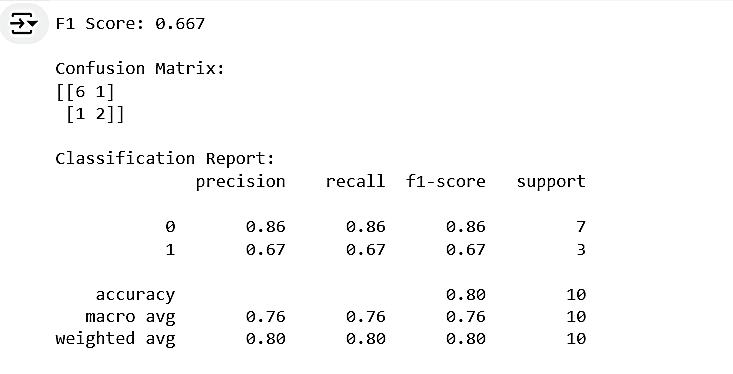
f1 = f1_score(y_true, y_pred)
print(f"F1 Score: {f1:.3f}")
# Detailed analysis
cm = confusion_matrix(y_true, y_pred)
print("\nConfusion Matrix:")
print(cm)
# Full classification report
report = classification_report(y_true, y_pred)
print("\nClassification Report:")
print(report)Output
Multiclass and multilabel F1 classification
For more than two classes, F1 can be averaged in several ways:
Multiclass and multilabel F1 classification
For more than two classes, F1 can be averaged in several ways:
- Macro Average: Calculates F1 for each class separately and then takes the arithmetic mean. This method treats all classes equally, regardless of their size, making it sensitive to minority class performance.
- Micro Average: Aggregate the total TP, FP, and FN across all classes, then compute F1. It is good for more than two classes in imbalanced datasets.

- Weighted Average: Calculates F1 for each class, weighted by class frequency. It balances class size and performance metrics. The weighted average F1 will be between micro and macro F1.
Pro Tip: Check out 12 Best Data Annotation Tools for Computer Vision (Free & Paid)
Limitations and Considerations
While F1 is widely used, especially in multiclass classification, it has some limitations:
- Ignores True Negatives: F1 does not use the true negatives, so it only measures the positive class performance metric.
- Equal Weighting: Standard F1 score assumes both precision and recall have equal importance. Most applications require different emphasis on these metrics, which makes Fβ scores or custom evaluation approaches more appropriate.
- Threshold-dependent: F1 is computed at a specific classification threshold, typically 0.5. Changing the threshold can alter precision and recall.
- Interpretation: F1 can be less intuitive than accuracy for non-technical audiences.
- Multi-class Complexity: Needs careful averaging for multi-class classification problems.
- Loss of Detail: Two models with the same F1 can have very different precision and recall.
Below are some alternatives to consider:
- Use the Matthews Correlation Coefficient (MCC) when true negatives are important.
- Use PR-AUC when threshold-independent evaluation is needed for positive class performance.
- Always report the model’s precision and recall with F1 for full context.
How Lightly AI Helps You Achieve Better F1 Scores
Effective model evaluation depends heavily on the quality and balance of your training data.
Lightly AI offers tools for data curation that help ML teams identify the most informative and diverse samples for labeling.
Focusing labeling efforts on high-value data allows Lightly to reduce redundancy and address class imbalance more effectively. These are two common challenges that directly affect metrics like precision, recall, and F1 score.
Its self-supervised learning methods (e.g., contrastive learning) enable models to learn useful data representations without needing many labels. This results in faster training and improved model robustness. This approach is especially valuable for applications where positive classes are rare or costly to label, such as fraud detection or medical diagnostics.
Lightly’s data-centric platform integrates smoothly into your ML workflow. It helps improve the quality of the entire dataset, reduce labeling costs, and enhance model performance metrics.
This short demo video shows how curated data can boost F1 and other model metrics.
https://www.youtube.com/watch?v=OoHZcZ5e-54
Pro tip: Have a look at our list of 10 Best Data Curation Tools for Computer Vision [2025] to compare your choices.
Conclusion
The F1 is a key tool for evaluating classification models, especially when addressing class imbalance or the impact of false positives and false negatives. It offers a more balanced view of model performance than accuracy, which can be misleading in some cases.
For multi-class scenarios, macro and micro F1 scores offer a balanced assessment of model performance. Additionally, weighted F1 accounts for the relative contribution of each class to the overall score.
As machine learning continues to progress, the F1 score will remain critical for artificial intelligence (AI) professionals. It’s important to combine the F1 score with other metrics and prioritize quality data curation to achieve accurate and actionable model evaluations.

Stay ahead in computer vision
Get exclusive insights, tips, and updates from the Lightly.ai team.


.png)
.png)