
The Practitioner Guide to Active Learning in Machine Learning
Table of contents
Share blog post


Learn how active learning can be used to build a data flywheel where only data is getting labeled and used for training that actually matters.
Share blog post
Machine learning (ML) engineers today have access to large amounts of unlabeled data. Labeling that data for computer vision tasks like object detection or segmentation is a bottleneck. It requires significant time and cost to annotate thousands of images.
Active learning has emerged as a solution to this problem by intelligently selecting which data points actually need human labeling.
In this guide, we’ll detail everything you need to know about active learning, with a focus on computer vision applications.
We will cover the following:
- What is active learning in machine learning?
- How does active learning work (the active learning loop)
- Active learning vs. passive learning vs. semi-supervised learning
- Key active learning strategies and query algorithms
- Active learning in practice: Computer vision use cases
- Challenges and best practices in active learning
- Active learning with Lightly (Building a data flywheel)
Active learning works best when paired with smart data curation and strong model foundations. At Lightly, we help you achieve this with:
- LightlyOne: Intelligently select the most relevant samples to label, so your team spends less time labeling and more time building better models.
- LightlyTrain: Pretrain and fine-tune models to get the most out of your curated data and improve accuracy.
Together, they create a continuous “data flywheel” that accelerates training, boosts performance, and cuts labeling costs for computer vision tasks.
💡Pro Tip: If you want to decide when to use labeled data versus letting the model learn patterns on its own, our Supervised vs Unsupervised Learning article explains the key differences and trade-offs between these approaches.
See Lightly in Action
Curate and label data, fine-tune foundation models — all in one platform.
Book a Demo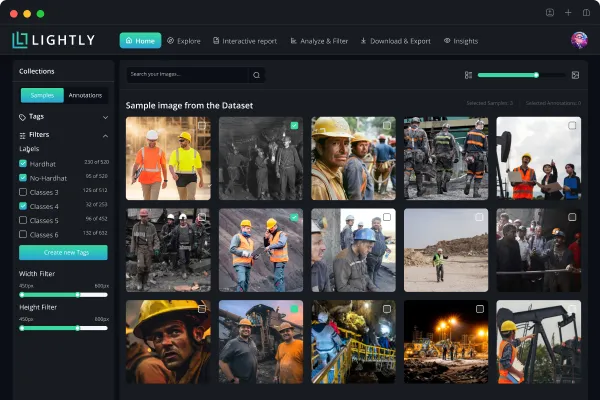
What is Active Learning?
Active learning is a machine learning approach where the learning algorithm actively interacts with a human annotator to get labels for new data points.
Instead of labeling an entire dataset randomly, it queries the examples from a pool of unlabeled data that are expected to provide valuable information to improve model performance.
In traditional supervised learning methods, the algorithm learns from a set of data that's already labeled. But, in active learning, the algorithm can itself select the data it wants to learn from. It's still a supervised machine learning approach because humans provide labels.
Pro Tip: Looking for the perfect tool to label your data? Check out 12 Best Data Annotation Tools for Computer Vision (Free & Paid).
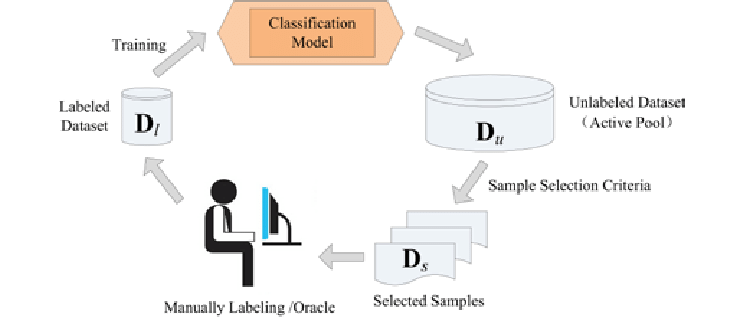
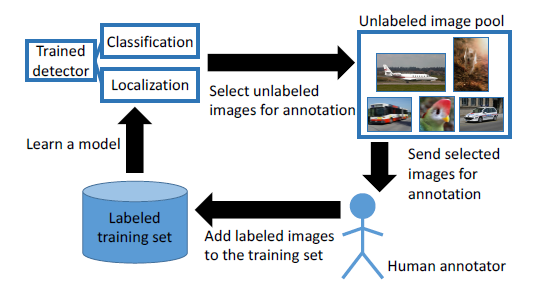
How Does Active Learning Work (The Active Learning Loop)
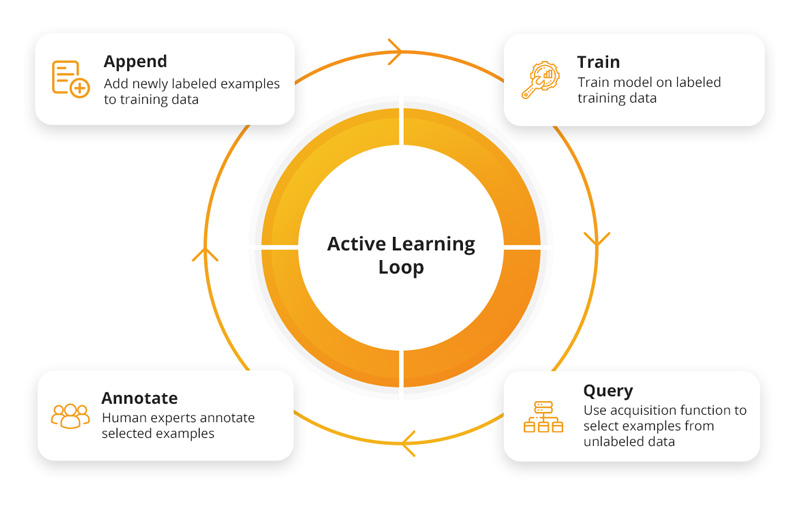
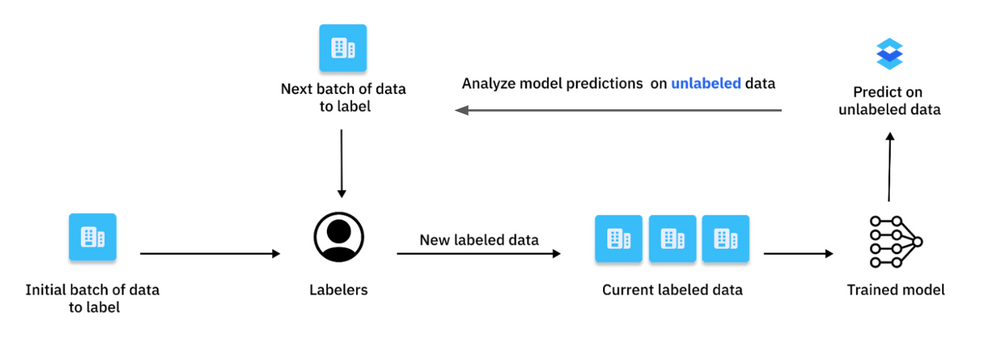
The active learning process is a repeated cycle and improves a machine learning model step by step. It also reduces the amount of manual data labeling needed.
Step 1: Initial Training
The process usually starts with initialization, where a few small training samples of labeled data is used to train the first version of the model. This initial set of labeled training data gives the model a start to recognize patterns and relationships in the data, and lets it work better than random guessing.
Step 2: Inference on the Unlabeled Pool
After the initial model is trained, it assesses a set of unlabeled data instances. For each data point, the model calculates a score (a set of probabilities over the possible classes) that shows its confidence or uncertainty.
Step 3: Querying via an Acquisition Function
Using the model's guesses, a query strategy selects the most valuable data points from the unlabeled samples. Data points with higher scores are expected to produce a higher value for model training if they get labeled.
What counts as the most valuable depends on the active learning method we choose. Here is a list of basic sampling strategies.
- Uncertainty sampling
- Diversity sampling
- Expected model change
- Hybrid strategy
You can speed up the selection of the data using LightlyOne.
It is designed to have a processing engine, the LightlyOne Worker. You can install LightlyOne and then start the LightlyOne Worker with the command shown in the LightlyOne Platform.
Once the worker is up and running, you can create a job to process the data. The example code below shows how to schedule a LightlyOne Worker run with a custom selection.
from lightly.api import ApiWorkflowClient


# Create the LightlyOne client to connect to the API.
client = ApiWorkflowClient(token="MY_LIGHTLY_TOKEN", dataset_id="MY_DATASET_ID")


# Schedule the compute run using a custom config.
# You can edit the values according to your needs.
scheduled_run_id = client.schedule_compute_worker_run(
    selection_config={
        "n_samples": 50,
        "strategies": [
            {
                "input": {
                    "type": "EMBEDDINGS"
                },
                "strategy": {
                    "type": "DIVERSITY"
                }
            }
        ]
    },
)
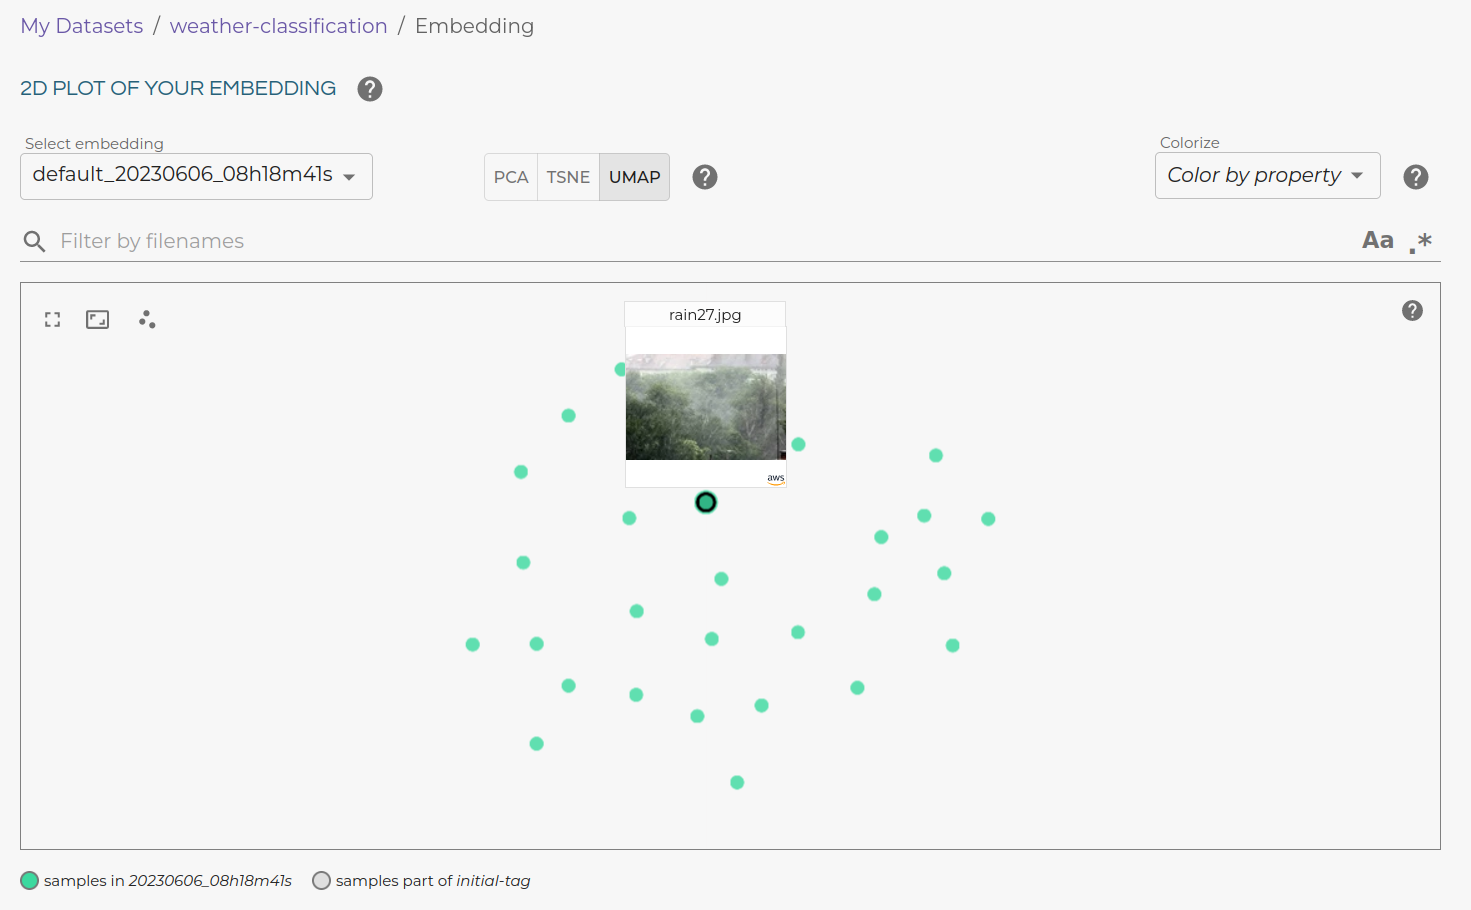
With LightlyOne's interactive interface, it’s easy to explore the selected data, get a clear overview, and confidently choose the most diverse samples to send for labeling.
Step 4: Oracle Annotation (Human-in-the-Loop)
The selected data points are sent to a human for labeling. Human annotators (oracle) use their knowledge to give correct labels to resolve ambiguities or classify challenging examples.
Step 5: Augmenting the Labeled Set and Model Retraining
Next, the newly labeled data is added to the existing training data. The model can then retrain with this new, enhanced data to improve the overall outcome. This continuous feedback loop allows the model to learn from its previous uncertainties and improve its predictive accuracy.
The active learning loop repeats the steps from query strategy, human annotation, and model update in a cycle. This process continues until the model reaches a desired level of performance, stops improving, or meets another stopping rule.
Active Learning vs. Passive Learning vs. Semi-Supervised Learning
It's helpful to compare active learning with other common machine learning approaches. Each handles labeled and unlabeled data differently.
In passive learning, we start with a set of data that is already labeled. If we need more data, we have to label new samples randomly and manually. But active learning chooses the most informative data points from a pool of unlabeled data for a person to label.
Active learning also differs from semi-supervised learning, which attempts to figure out labels for unlabeled data points itself without asking a human for labels.
It's also important to understand here that active learning differs from reinforcement learning, which uses rewards to teach the model to make better decisions. It also differs from data augmentation, which generates new data by modifying existing labeled examples.
Although some active learning methods do generate new data to label using query synthesis methods, this is a less common approach.
Here is a table summarizing the key differences:
Key Active Learning Strategies and Query Algorithms
We've learned that active learning improves model training by selecting valuable data points from unlabeled datasets. The process of selecting data points, or query strategy, can be categorized into the following methods.
1. Uncertainty Sampling
The model picks the unlabeled samples it is least confident about. There are different ways to see how uncertain the model is:
- Least Confident Score: The model targets the sample where it is least sure about its most likely guess. For example, if in a 3-class problem, the model predicts probabilities like (0.4, 0.3, 0.3) for one sample and (0.9, 0.05, 0.05) for another. It will choose the first one because the model is less confident about its top guess.
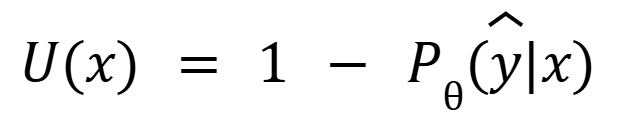
- U(x) is an acquisition function.
- Pθ(y|x) is the probability of the most confident prediction.
- Margin Sampling: The model selects examples with the smallest gap between the probabilities of the two most likely classes. This helps find cases where the model is unsure about its top options.
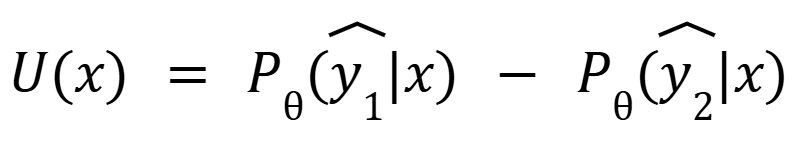
- Where y1 and y2 are the most likely and the second likely predicted labels.
- Entropy Sampling: The model picks the instance with the highest entropy in its prediction. High entropy means the model's guesses are spread out across many classes and have a higher level of uncertainty.
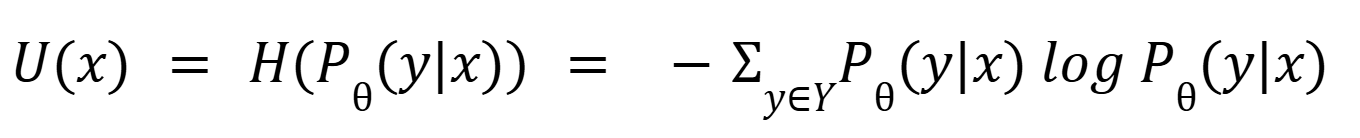
- H(Pθ(y|x)) is the conditional entropy.
💡Pro tip: Check out 10 Best Data Curation Tools for Computer Vision.
2. Query-by-Committee (QBC)
QBC strategy uses an ensemble of multiple models. Each model is trained on the current labeled data, but they might make different decisions due to variations in initialization or architecture.
All the models make predictions on unlabeled data points to select data to learn from next. QBC then picks the data point where the models disagree the most, because this shows they are unsure or confused about that point.
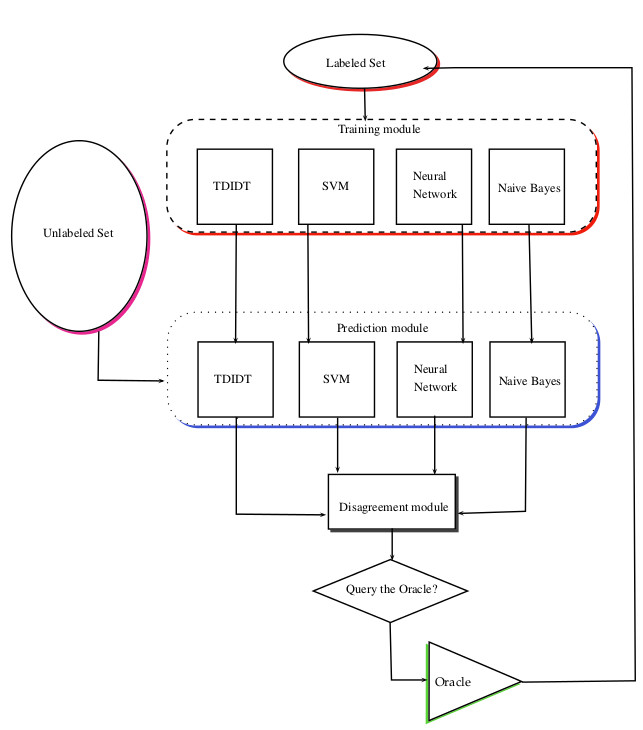
The query by committee method is better than uncertainty sampling because it considers the overall uncertainty of all models. But it needs more computing power because of training and keeping track of many models.
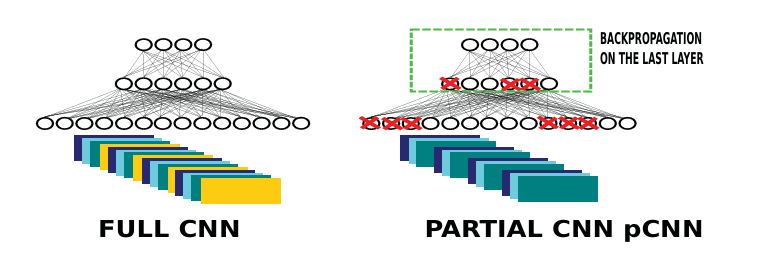
The paper (Active learning strategy for CNN combining batchwise Dropout and Query-By-Committee) presents a low-computation adaptation of the Query-By-Committee (QBC) strategy for deep learning.
Deep neural networks usually have many parameters, which makes training multiple full networks slow and resource-intensive.
Instead, the authors train a CNN on selected samples, chosen by a committee of partial CNNs created through batch-wise dropout on the full CNN. This method helps save computational costs compared to traditional query-by-committee (QBC) methods.
3. Diversity-Based Sampling
Although uncertainty sampling focuses on the most difficult examples for the model, it can sometimes choose very similar data points.
Diversity-based sampling aims to select a group of data points that are uncertain, different from each other, and represent the overall data. This is often done by using data features or embeddings.
The process might first filter uncertain samples, then use clustering methods to group these samples. Alternatively, it can select a diverse set using a core-set approach based on their features.
This helps cover more data variety and prevents the model from focusing on a small subset of data.
Example code to choose 100 samples that are visually diverse equals diversifying samples based on their embeddings using LightlyOne:
{
    "n_samples": 100, # set to the number of samples you want to select
    "strategies": [
        {
            "input": {
                "type": "EMBEDDINGS"
            },
            "strategy": {
                "type": "DIVERSITY"
            }
        }
    ]
}
4. Expected Model Change / Expected Error Reduction
The expected model change is another general active learning framework that uses a decision-theoretic approach. It involves selecting the instance that would impart the most change to the current model if we knew its label.
On the other hand, the expected error reduction measures how much a model's mistakes are likely to be reduced in the future, rather than just how much the model might change now.
The idea is to estimate the model's future error when trained with current labeled data plus a new sample from unlabeled data. The sample expected to minimize the most errors is selected for labeling.
5. Membership Query Synthesis
In the membership query synthesis approach, the active learning model doesn't pick data points from a pre-existing set. Instead, it creates new, fake data and asks a human to label it.
It helps the model explore the data areas that are not covered by existing data.
However, it's often hard to use in computer vision because making realistic images that a human can label is difficult. The fake data might look unrealistic or not belong to the same data group as the real data.

6. Hybrid Approaches
Practically, most active learning strategies are usually hybrids. For example, a common approach is to combine uncertainty and diversity.
The algorithm might first take a large group of uncertain samples that the model isn't sure about. Then, it chooses a smaller, diverse group from that larger set to label.
This way, the active learner targets weak spots in the model while exploring different aspects of the dataset.
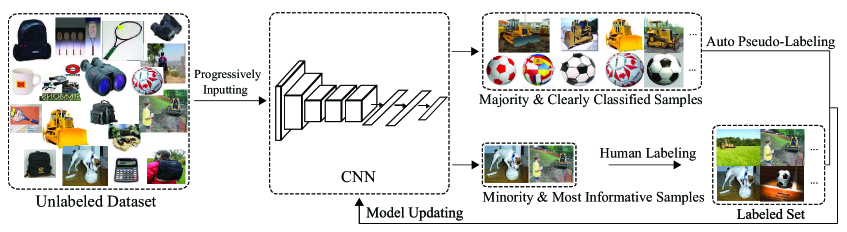
The CEAL framework (Cost-Effective Active Learning) is a hybrid approach. It combines uncertainty sampling with pseudo-labeling, a semi-supervised technique. It asks humans to label low-confidence images while assigning labels to high-confidence ones automatically.
Here is a table comparing active learning query strategies and their trade-offs.
Active Learning in Practice: Computer Vision Use Cases
Active learning is useful for computer vision tasks because labeling data is a bottleneck. Here are some of its common use cases:
Image Classification
Active learning greatly reduces the number of images that need labeling for image classification by focusing on the most uncertain images.
For example, a model built to classify different dog breeds might struggle to distinguish between a Siberian Husky and an Alaskan Malamute.
Instead of labeling thousands of random dog pictures, an active learning system would query the specific images where it's unsure between these two breeds. This way, the model quickly learns the subtle features that separate them by getting human input on these difficult pictures.
Object Detection
Labeling images for an object detection task is expensive as it requires identifying the presence of objects and drawing precise boxes around them. It demands a high level of attention to detail. Meeting this demand needs specialized tools and trained annotators, which further increases the cost and effort involved.
Active learning helps by finding the images where the model is uncertain or likely to make mistakes, so those can be labeled first.
For example, the model might be uncertain about a pedestrian partially hidden in the shadows at dusk or a cyclist seen from an unusual angle.
The active learning system flags these kinds of images so labelers can work on them next. It improves the model by catching and fixing complex cases and increasing its accuracy and reliability in real-life situations.
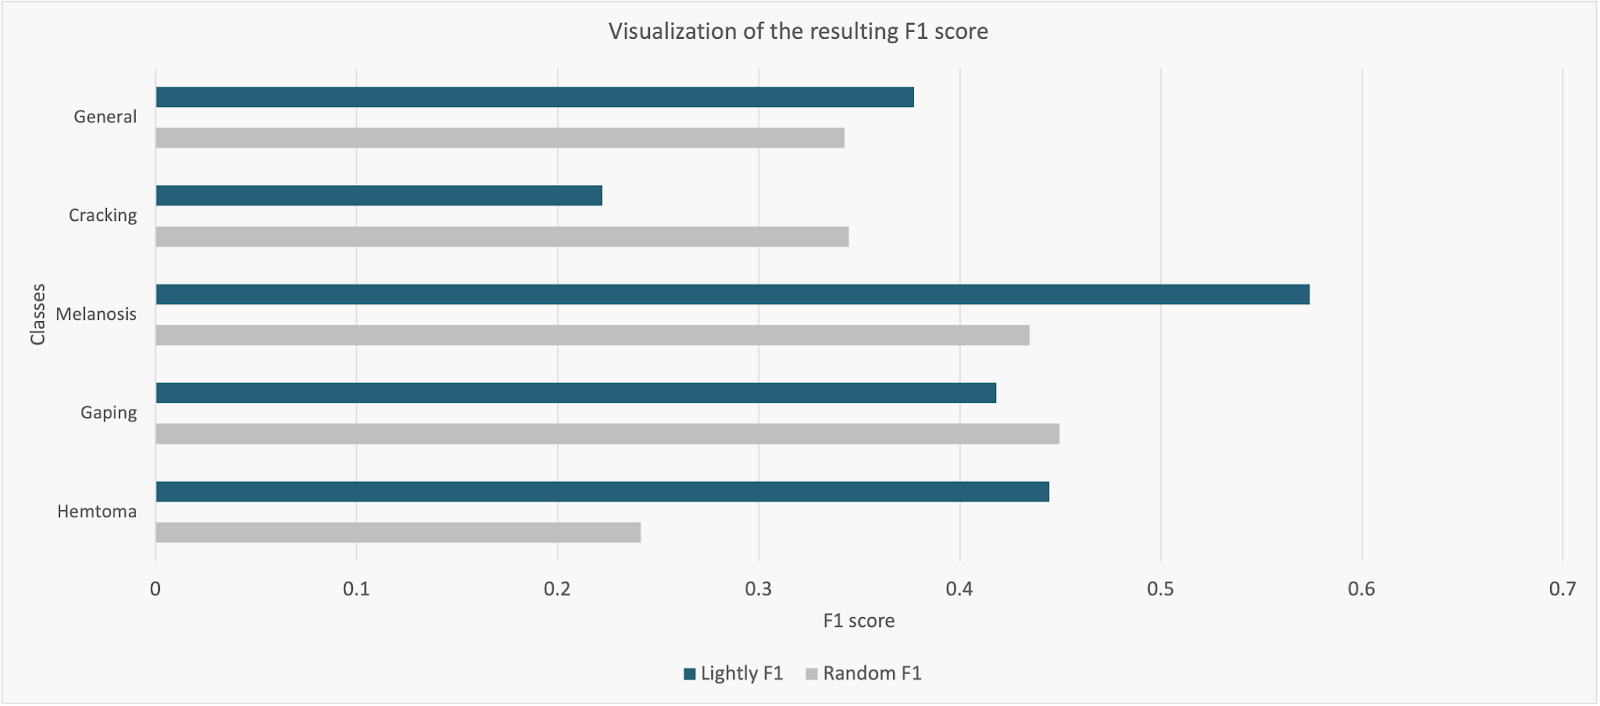
A notable example is Lythium's salmon defect detection case study. The team faced a challenge in labeling thousands of new images generated each day. Manual processes failed to provide enough room to scale.
So, they used the Lightly platform to perform active learning at scale and select the most diverse images that could improve the detection model's accuracy.
Using only 1,000 selected images, they were able to enhance the recall and F1-score of their object detector by 32% and 10%, compared to their previous data selection method.
💡Pro tip: Learn more about object detection from our guide titled YOLO Object Detection: Models, Tools, Use Cases.
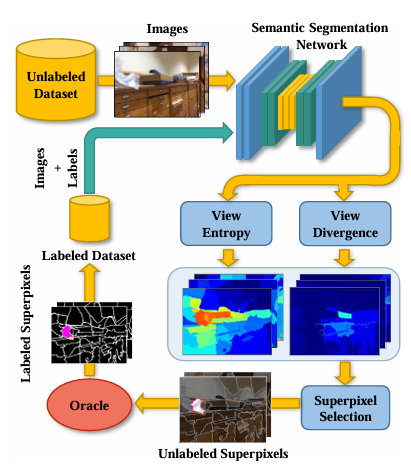
Semantic Segmentation
Semantic segmentation requires labeling every pixel in an image, which makes it time-consuming. Active learning helps by selecting images or even specific regions that yield the highest uncertainty.
For example, in medical imaging, a model that identifies tumors in MRI scans might be unsure about the exact boundaries of a tumor.
The active learning system would then show these unclear areas to a radiologist to get them labeled accurately. It allows the expert to focus on the most critical pixels, which speeds up the process of creating a highly accurate segmentation model.
Other Domains
Although our focus is on computer vision, active learning principles apply to many other areas, too.
Active learning in natural language processing (NLP) helps data scientists with tasks such as sentiment analysis, named entity recognition, and text classification.
Since labeling text manually can take more time, active learning focuses on the most ambiguous or novel sentences to save time and effort.
Financial services use active learning to spot transactions that might be fraudulent or are unusual or unclear, so that humans can review them more effectively.
Active learning is also applied to drug discovery. It helps choose which chemical compounds are worth investigating further by reducing the number of experiments needed.
Challenges and Best Practices in Active Learning
While active learning offers many benefits, it also comes with a set of challenges.
One primary challenge is the cost of human annotation, especially for complex machine learning tasks that require experts with in-depth knowledge to provide labels.
Another problem is scalability, since retraining the model repeatedly with large amounts of data can use more computing power.
There is also a risk that the active learning algorithms may select biased or unhelpful unlabeled data instances. It could make the model worse rather than improve it.
For maximum outcome from the active learning machine learning algorithm and to reduce these challenges, consider the following best practices:
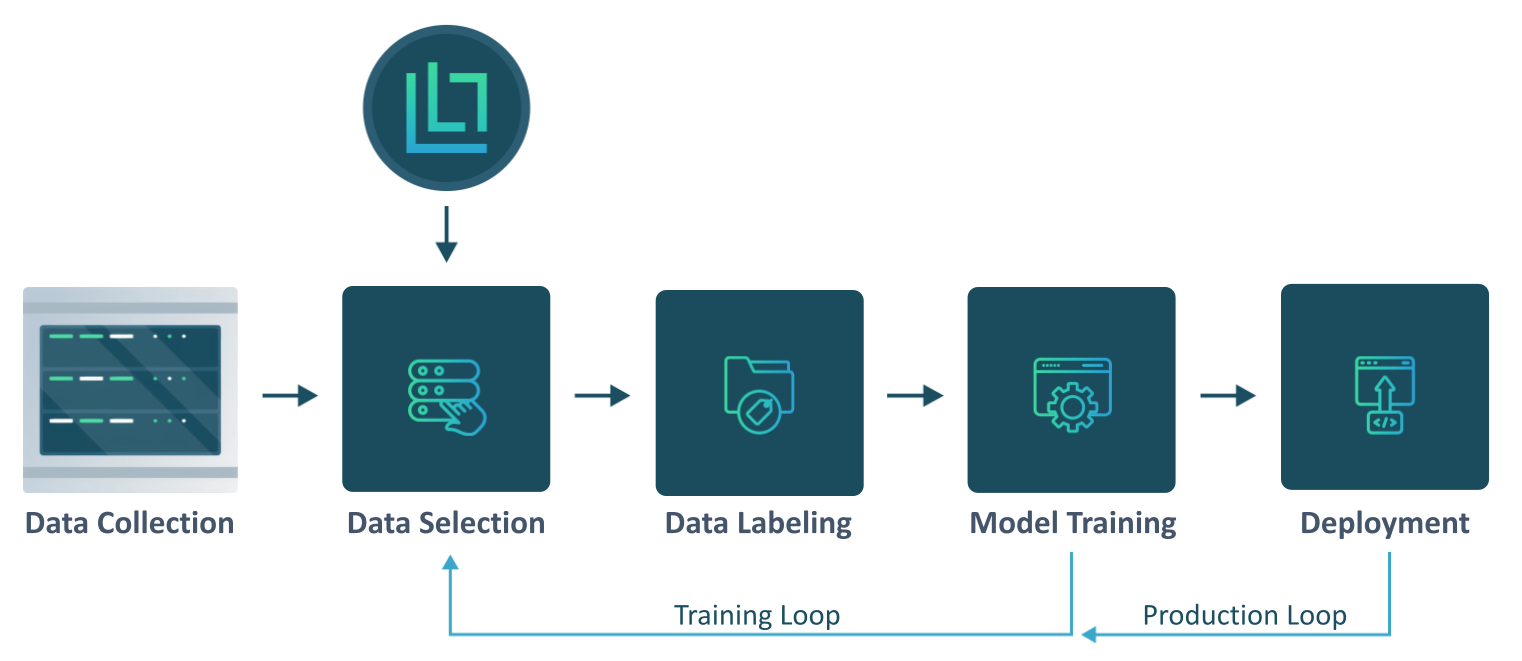
Active Learning with Lightly (Building a Data Flywheel)
Setting up a complete active learning frame can be quite time-consuming, especially if you want to use and combine multiple methods. At Lightly, we’ve developed a platform that implements most of these methods and supports seamless integration between them.
You can build a continuous data curation cycle, where your data, models, and annotation work together to improve over time.
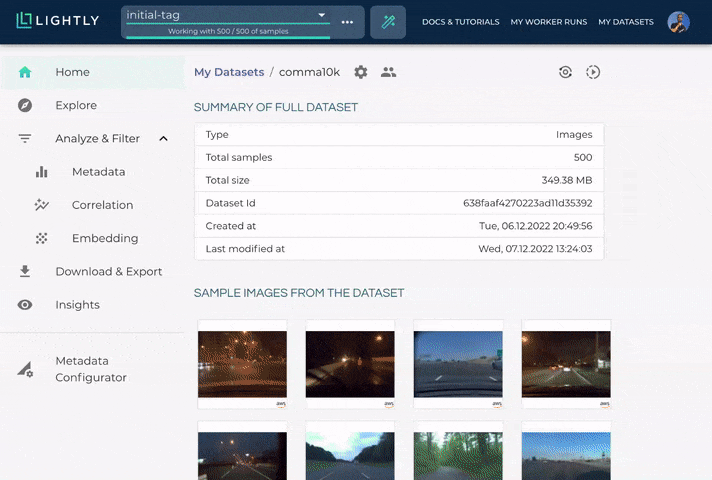
LightlyOne Platform
Instead of building your own active learning solution, you could use a platform like LightlyOne. It uses advanced active learning algorithms that help you process large amounts of unlabeled data and select the most informative samples to label.
LightlyOne greatly reduces data annotation effort and maximizes impact on model performance.
Embedding-based Selection
Lightly uses embeddings to evaluate similarity and diversity between images.
The platform computes embeddings for all unlabeled images using vision models. Then, it performs selection in that embedding space to find edge cases or new groups of the image data that the model hasn’t seen before.
Embedding-based selection is much more effective than random sampling and enables smarter coverage of the data distribution.
💡Pro Tip: The powerful visual features learned by models are captured as embeddings. These embeddings are numerical representations crucial for understanding image content and similarity.
Typicality and Outliers
We added a new key feature, Typicality-Based Selection, in our latest Lightly 3.0 version. It helps see how “typical” (representative) or atypical (unusual) a data point is compared to your current training dataset.
Atypical points might be valuable to label if they represent new scenarios, and Lightly can address this automatically by balancing:
- Density Awareness: Ensures that dense clusters of common patterns are well represented, preserving the core structure of your data.
- Diversity: Ensures a wide range of examples are common to your dataset.
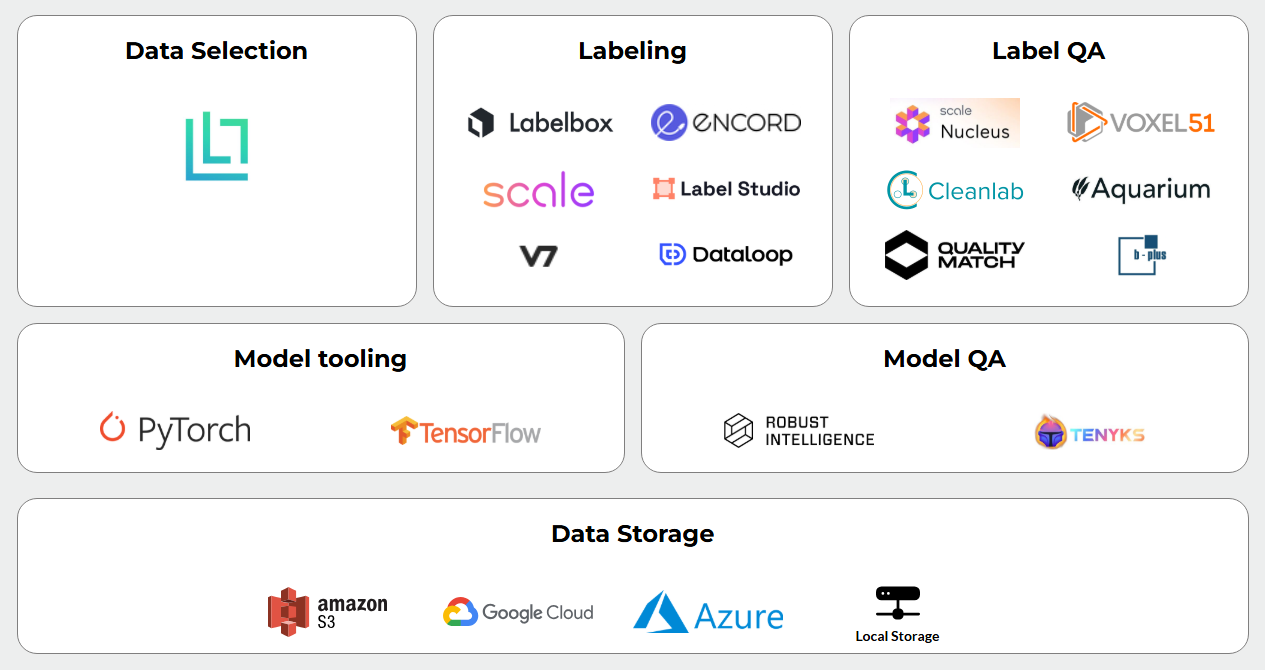
Human-in-the-Loop Integration
Lightly’s solution can integrate with labeling tools or services and become the middleman between your unlabeled data pool and data annotation process. It can send selected samples to be labeled, then pull them back into training and automate the active learning loop.
Lightly saves considerable engineering effort for teams trying to implement active learning from scratch.
Now, how can you test Lightly’s active learning features? You can check Quickstart. We also recommend the tutorial on combining many different Active Learning methods to improve the YOLOv8 object detection model.
Active Learning in ML: Conclusion & Key Takeaways
The availability of quality labeled data is the primary bottleneck restricting applications in several domains.
Since such data is hard to find, active learning offers a solution to this. It lets algorithms ask human experts to label the informative samples.
While implementing active learning can be complex, it enables models to achieve strong performance with fewer training samples.

Stay ahead in computer vision
Get exclusive insights, tips, and updates from the Lightly.ai team.

.png)
.png)


